Today's Surf Conditions at Mindelo
Spot Overview & Description
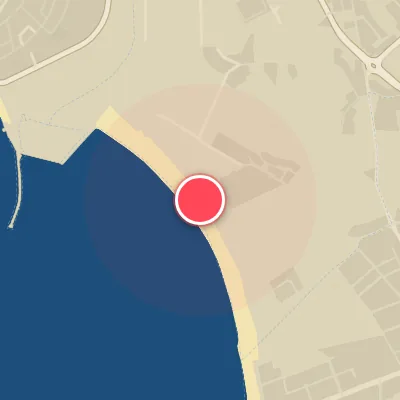
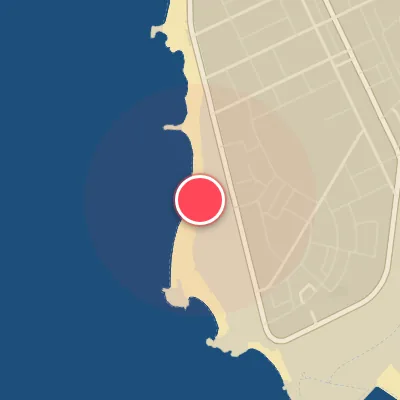
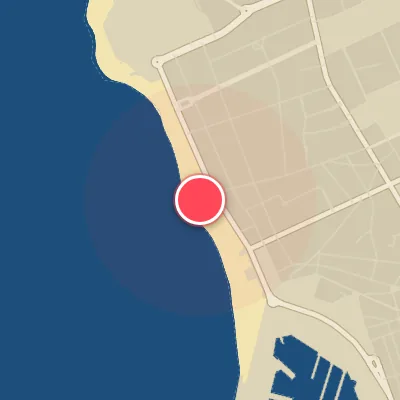
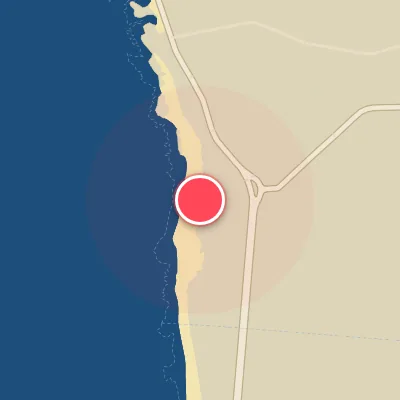
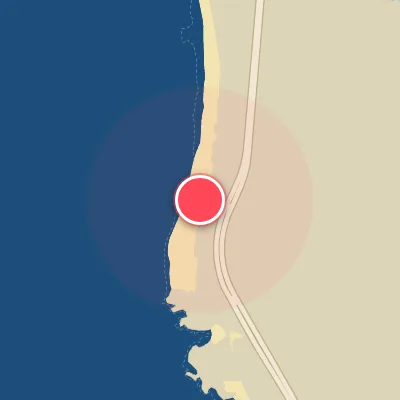
Perched on the northeastern edge of São Vicente, Mindelo presents a tantalizing question mark for the traveling surfer. The island’s exposed position to North Atlantic swells hints at potential, but details remain frustratingly murky. Without confirmed data on swell direction, wind, or tide preference, this spot demands on-the-ground reconnaissance. The city itself offers a vibrant, cultural base, but the waves—if they break—are still a local secret. Approach Mindelo as a true exploration: ask around, watch the charts, and let the Cape Verdean winds guide you to whatever lies beneath the surface. For now, treat it as a research project rather than a ready-made barrel. Surf at your own risk, but the reward could be a quiet lineup all your own.
Best Surf Season & Climatology
Best Surf Season (October - March)
October through March is when Mindelo truly turns on. The North Atlantic storm track pushes a conveyor belt of extratropical cyclones toward the Iberian Peninsula, generating consistent W, WNW and NW groundswell with average heights of 6.9-8.9ft (2.1-2.7m) and periods of 11-13s. The North Atlantic Oscillation plays a big role here - during negative NAO phases, the storm track is pushed south toward Portugal, which typically means larger and more consistent W/WNW swells for Mindelo. This is also the time of year when the Azores High weakens enough to let cold fronts roll over Portugal, often setting up offshore flow from the NE through ESE. With ideal wind percentages between 39 and 48 percent, the beach sees its cleanest, most powerful surf.
Detailed Surf Information for Mindelo
Detailed Surf Forecast
Access our detailed 8-day swell and wind forecast charts for Mindelo with tidal graphs, period ranges, and daily forecast text summaries.
Swell & Wind Statistics
Explore historical swell consistency, wave heights, and offshore wind windows month-by-month, compiled from over 40 years of data.
Historical Surf Report
Browse the historical database archives to view past wave reports and understand spot climatology during specific years and months.